Monitoring of Mediation Controllers
Attention
This section is specific to cyberelements Cleanroom infrastructures.
From the “Server Statistics” menu in the “System” console:
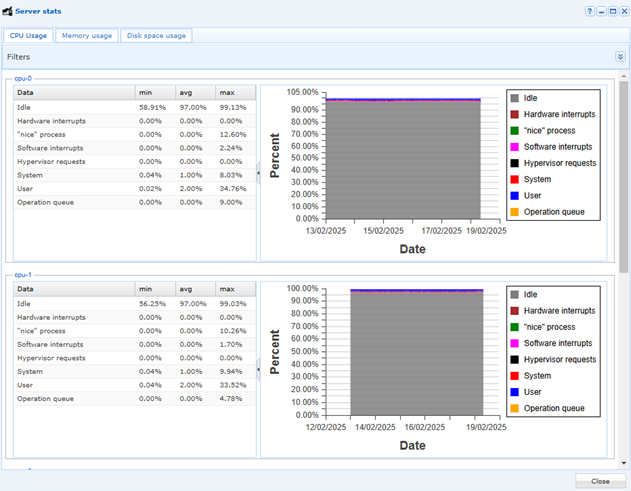
The dashboard provides information on CPU, RAM, and disk space usage for Mediation Controller servers:
Below is a list of services that can be monitored:
| Service | Description | Comment |
|---|---|---|
| apache2 | WEB Server | |
| collectd | Statistics collection and monitoring daemon | |
| cron | Regular background program processing daemon | |
| getty@tty1.service | Getty on tty1 | |
| snmpd | SNMP Daemon | |
| ssh | SSH Service | |
| rsyslog | System Logging Service | |
| networking | Network Service | |
| ntp | Network Time Service | |
| sysstat | Regular collection of system performance information | |
| ipdiva | LSB: Start IPdiva services | |
| ipdiva-hostmanager | LSB: Start/Stop the IPdiva hostmanager | |
| ipdiva-logger | IPdiva Logger Service | |
| ipdivasafe-emails | IpdivaSafeEmails | Emailing service |
| ipdivasafe-tasks | IpdivaSafeTasks | Background task management service (report) |
| cleanroom-vault | CleanroomVault | Vault |
| postgresql | RDBMS PostgreSQL | Cleanroom database |
| zope2.11.service | LSB: Start chrooted zope at boot time | |
| systemd-journald.service | Service log | |
| systemd-logind.service | Login service |