Access to the logs
Connection logs can be accessed in several places:
- The “
Control Center” for real-time viewing of current privileged access, - The “
Archives” for video recordings of privileged access, - The “
Reports” for connection logs,
The “Control Center” menu
The control center allows the session follow-up. It consists of two tabs:
Live streaming: visualization of current sessions,Archives: visualization of recorded sessions.
From the “Control Center” menu on the main workspace of the administration console:
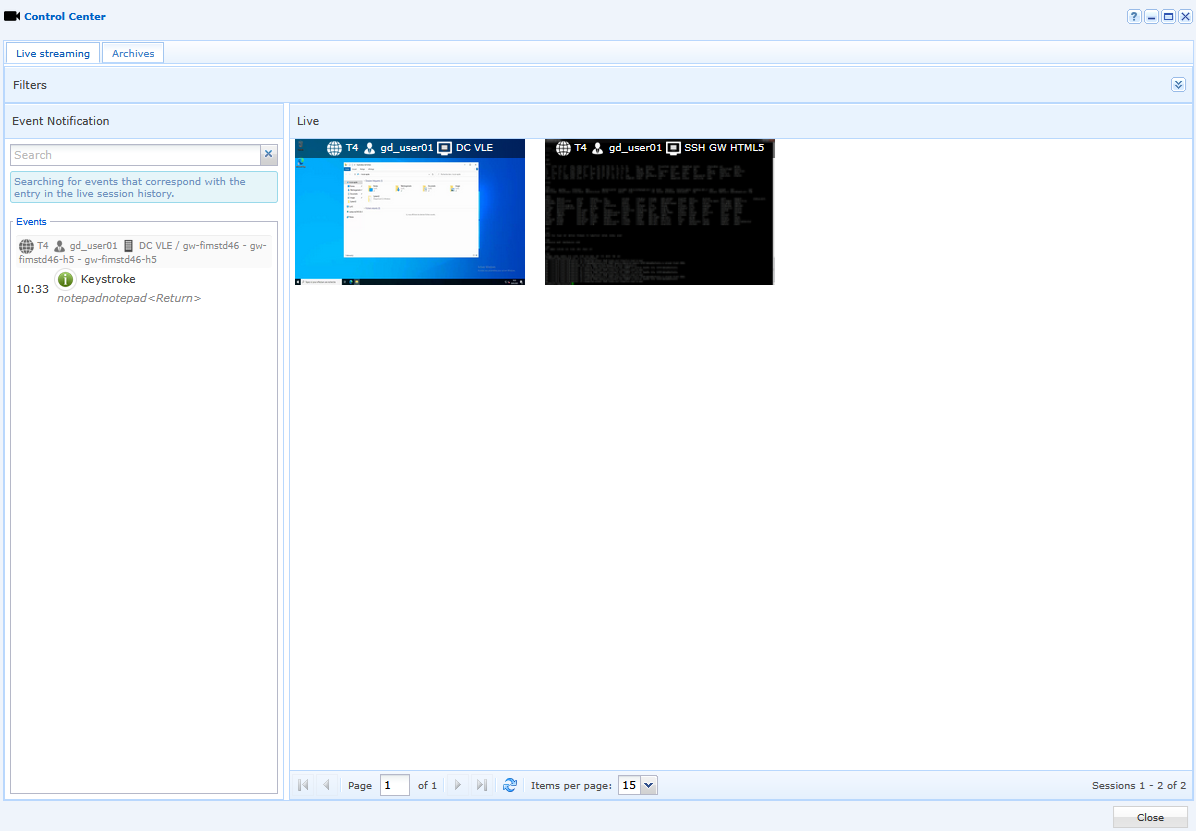
Overview of the “Live streaming” tab. It consists of three main areas:
Live,History,Filters.
The filtering area allows to filter actions and videos from specific users.
The "Show all data for all users" option allows to select everything (all users as well as their videos and their events). If this option is unchecked, the "Filter users" button is enabled.
To select the items to display, click on the "Filter users" button and a window allowing to choose the desired items will pop up. There is also the possibility to choose to disable the events of a session by hovering over the desired video with the cursor.
Click on the "Validate" button to validate the:

When hovering over a video, five options appear:
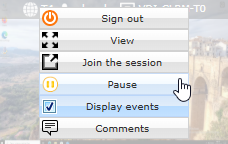
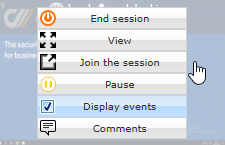
End session: closes the current sessionView: displays the video in full screen modePause: disables the keyboard and mouse, locks the sessionJoin the session: The “Join Session” option allows you to interact with the user's session. This option is only available for privileged HTML5 applications.Display events: displays or hides events related to this session. It is also possible to make this choice via the filter.Commentaires: Allows the administrator or supervisor to make an annotation on the video.
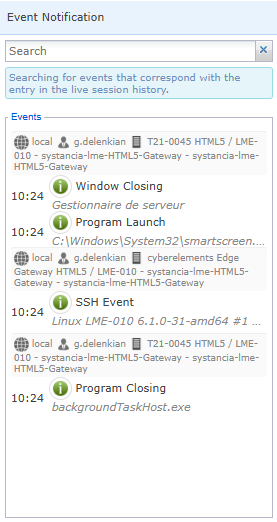
On this area of the screen the selected events are displayed in real time. A search bar allows you to filter the displays. These events concern all current sessions:
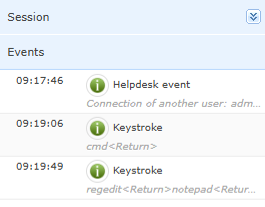
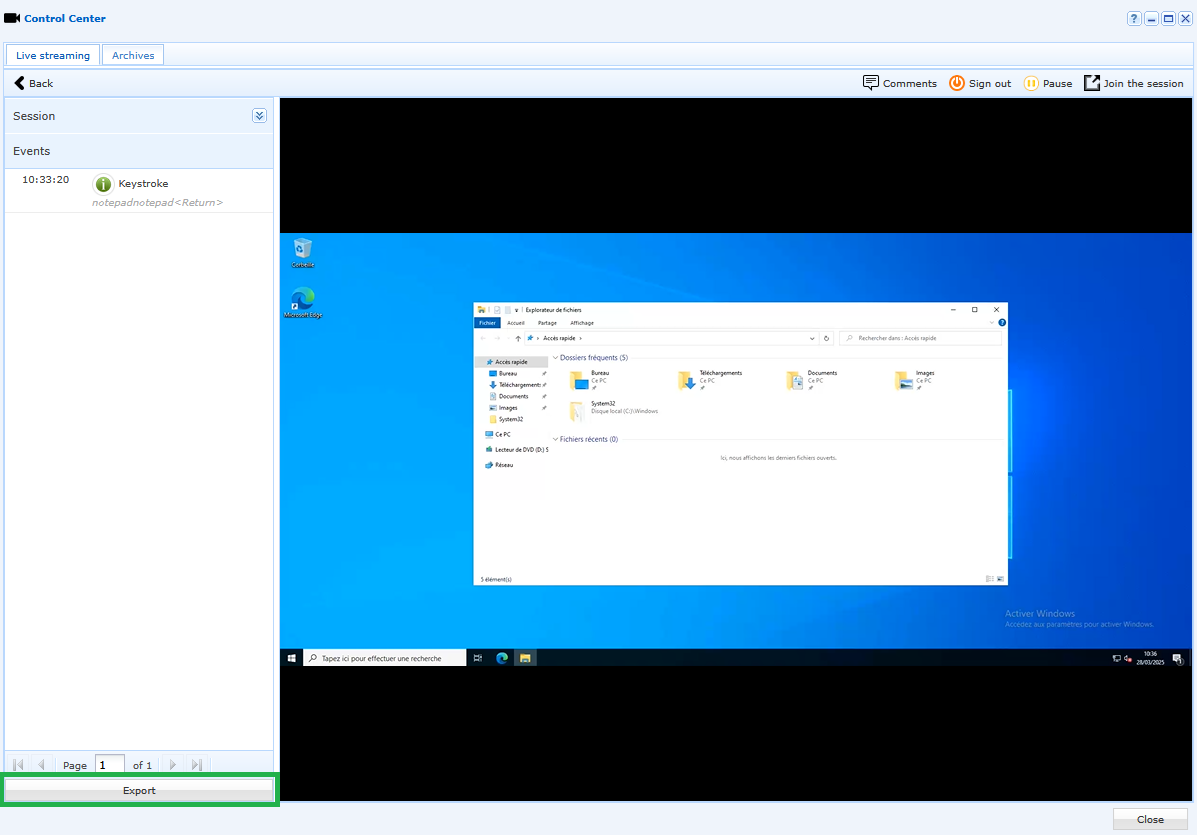
This screen allows to analyze a live session by viewing the video in large format. If necessary, it is possible to pause or stop the video by using the two buttons at the top right. A "Session" area on the left shows the user’s name, the machine's name and the date of the video currently displayed. As for the general plan, it is possible to view the events that appear in chronological order on the left:

When viewing any session, it is possible to export the list of events triggered in that session to a .csv file. To do this, an “Export” button is available in the events area. By default, the exported file has the same name as the recorded video. In the .csv file, events data are preceded by a frame containing information about the video and the date of export.
The “Archives” menu
From the "Archives" menu, of the main work plan of the administration console:
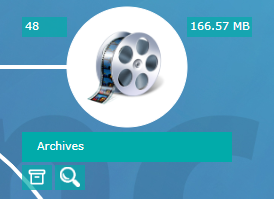
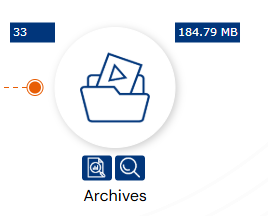
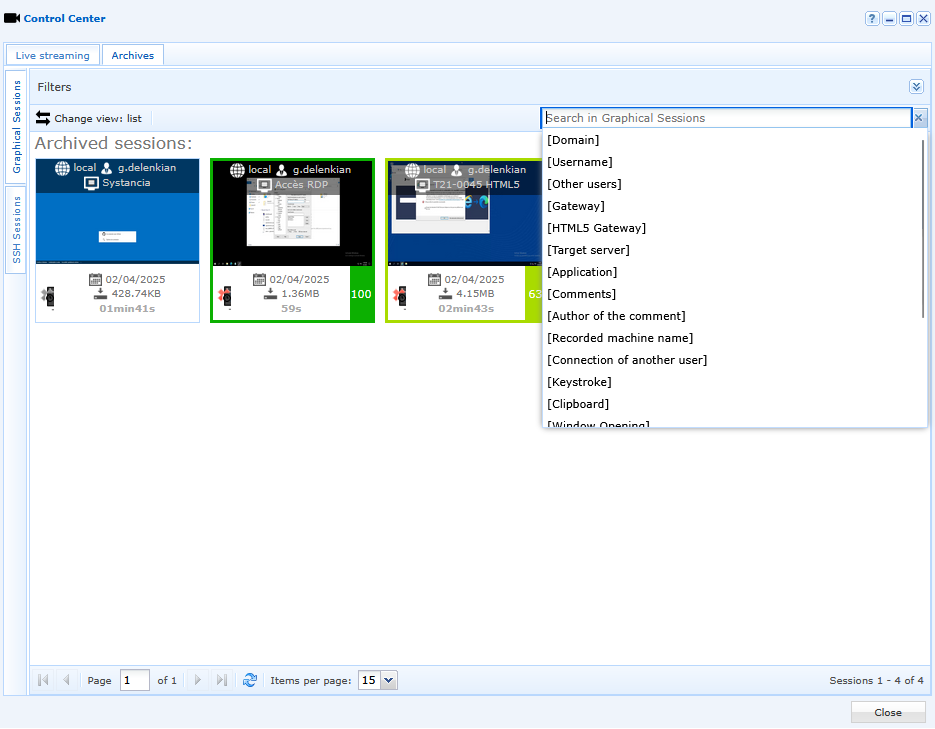
The "Archives" menu lists all available records of graphical sessions available as thumbnails. For each video displayed, various information can be seen on the thumbnail, such as the user's name, job title, resource type, user activity index, etc. :
It is possible to filter videos by service type, period, and user activity index:
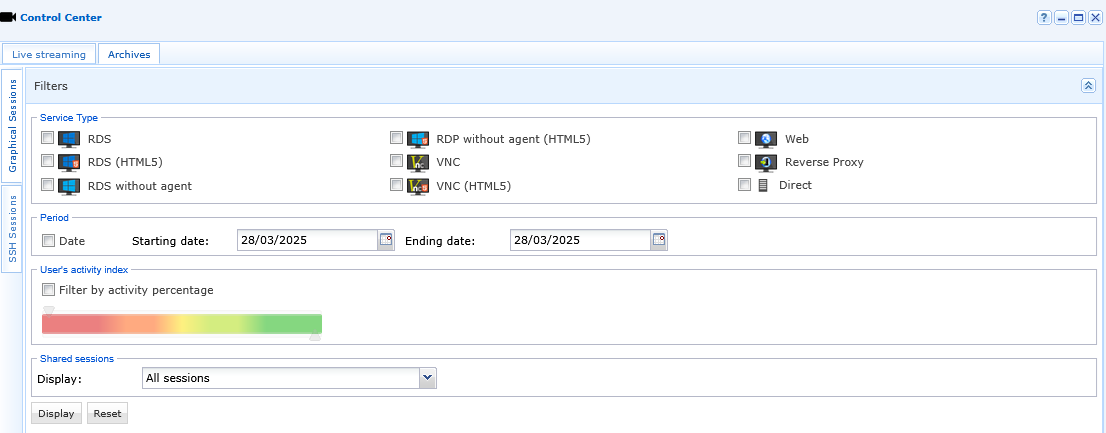
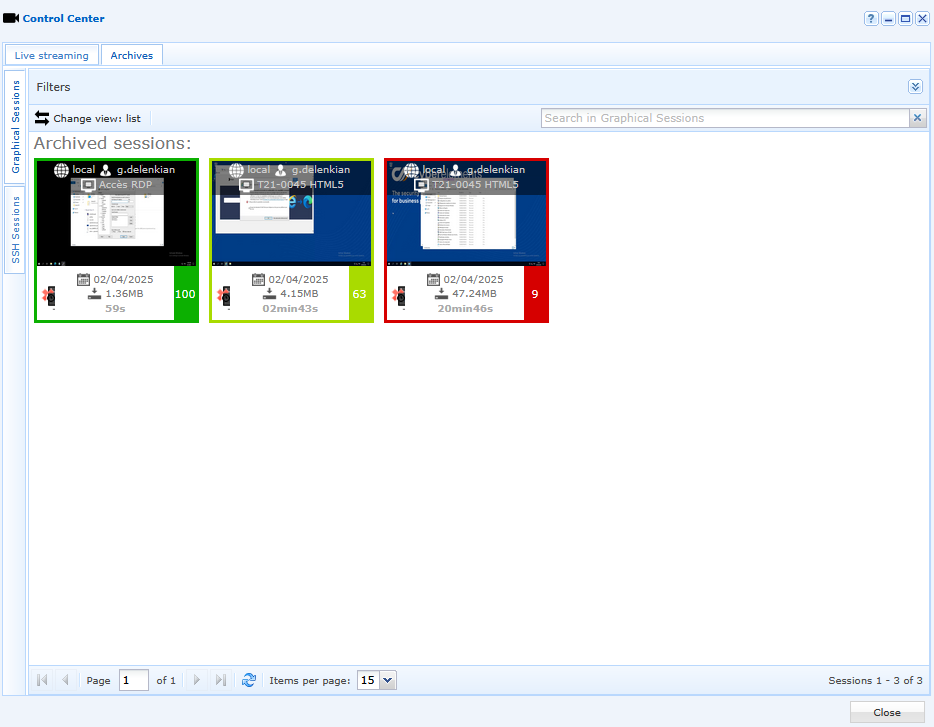
A video search bar is also available at the top of the window. This feature is very useful because it allows you to find a video based on keywords (e.g., a user's keystrokes, the launch of a program, etc.):
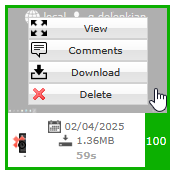
When hovering over an archived video with the mouse, it is possible to:
Viewthe video in large format,Commentthe video at a specific moment,Downloadthe video in .mp4 format,Deletethe video (the deletion of a video by an administrator will be notified in the “Reports” menu).
In this example, the word “cmd” was typed into the command prompt during a previous recorded user session. When searching for the keyword “cmd” in the archive section, the filter will update to highlight the single video in which the action was recorded:
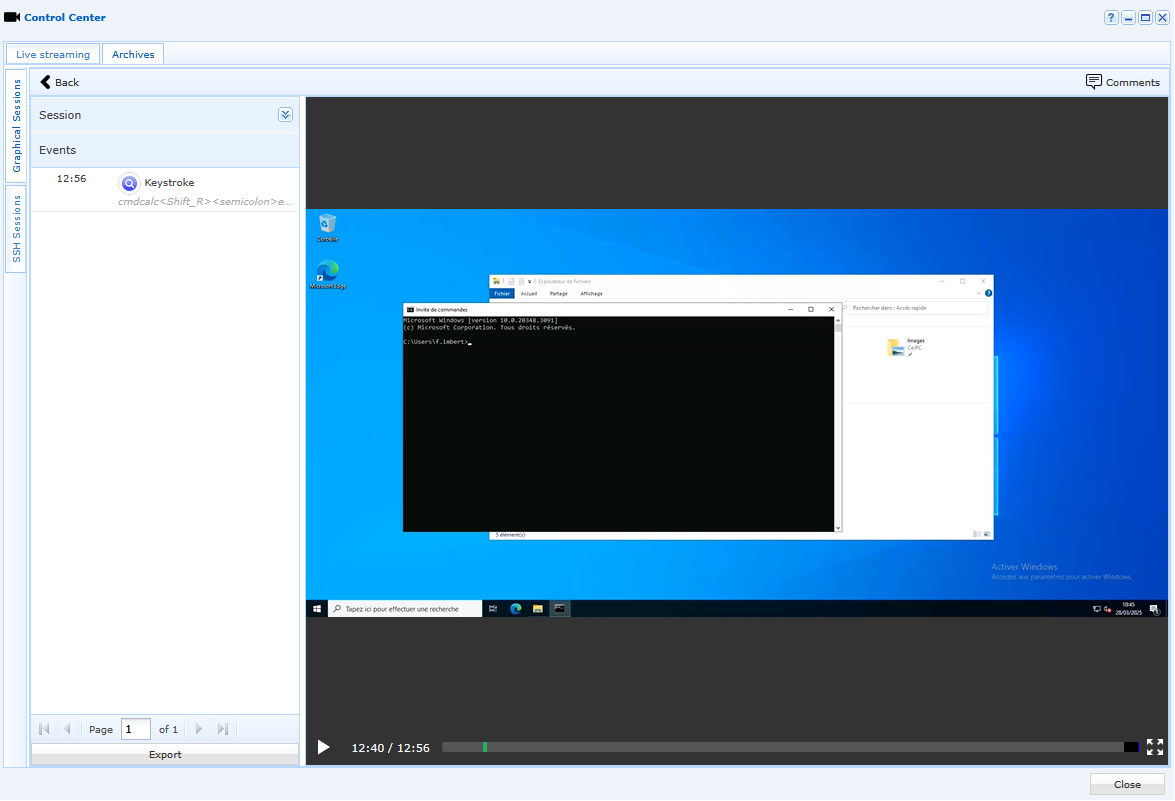
When viewing an archived video, the timeline at the bottom of the video will also refresh. The timeline will have chevrons indicating each event in the session. A blue chevron will indicate an element corresponding to the search performed (e.g., the moment when the keystroke was detected):


The “Reports” menu
From the “Reports” menu in the main workspace of the administration console:
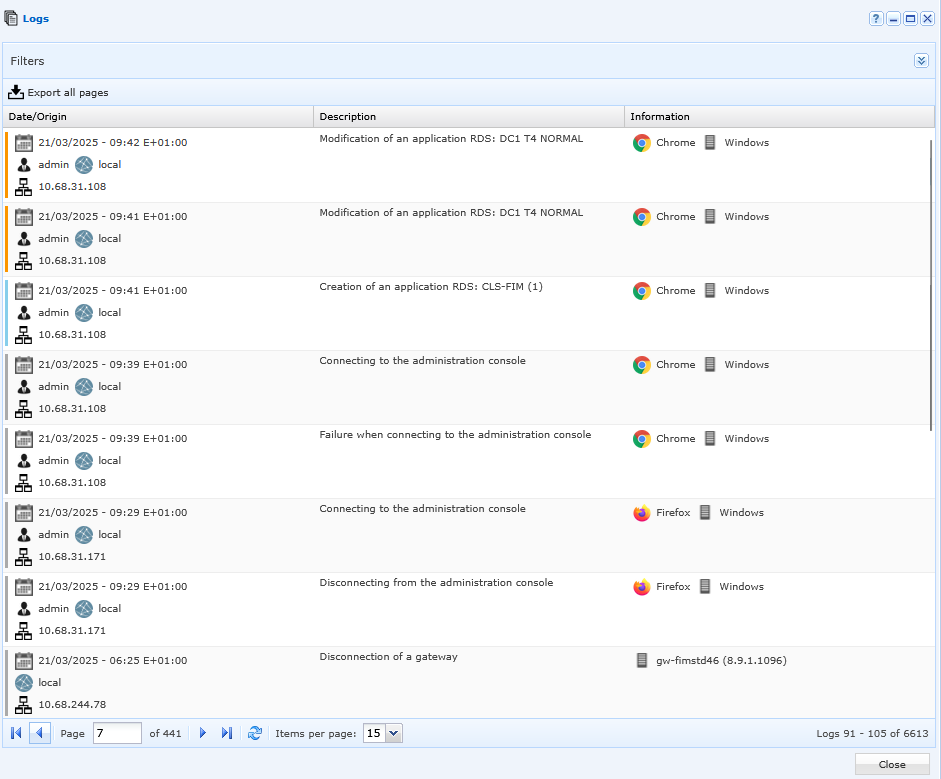
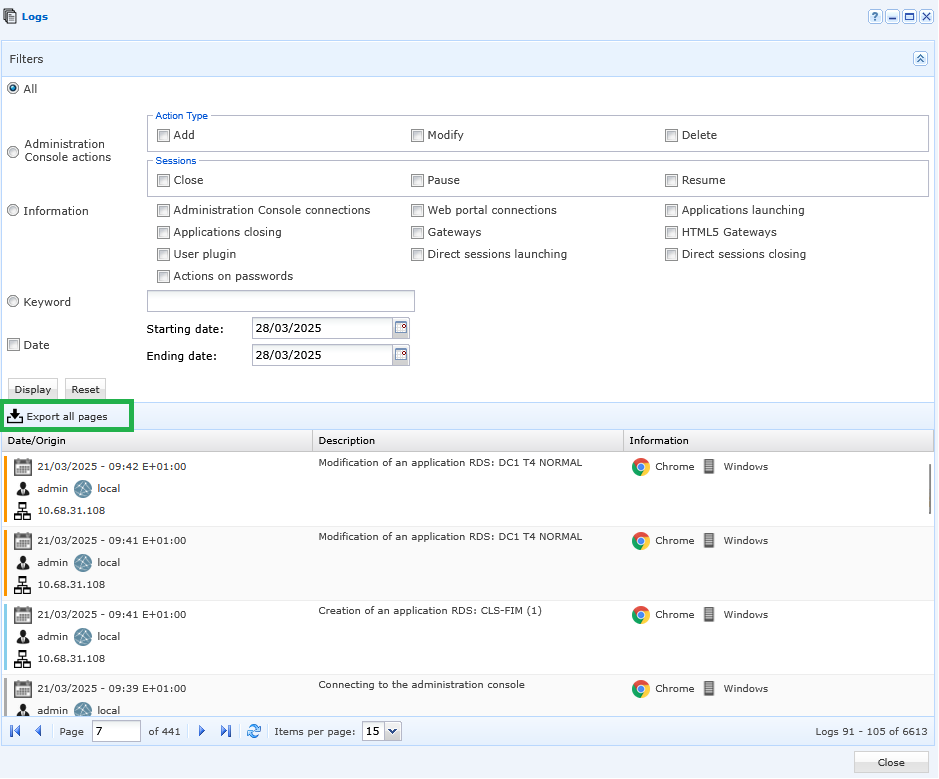
The report contains all the actions performed by users and administrators. The event history consist of three types of information:
Date/Origin: shows the date, the time, the user’s name, the domain and the IP of the machine from which the user signed in to perform the action,Description: shows the type of the event,Information: shows the browser and the operating system (OS).
A color code is assigned to each action:
Grey: connecting to/disconnecting from the administration console,Blue: creating an item,Red: deleting an item,Orange: editing an item.
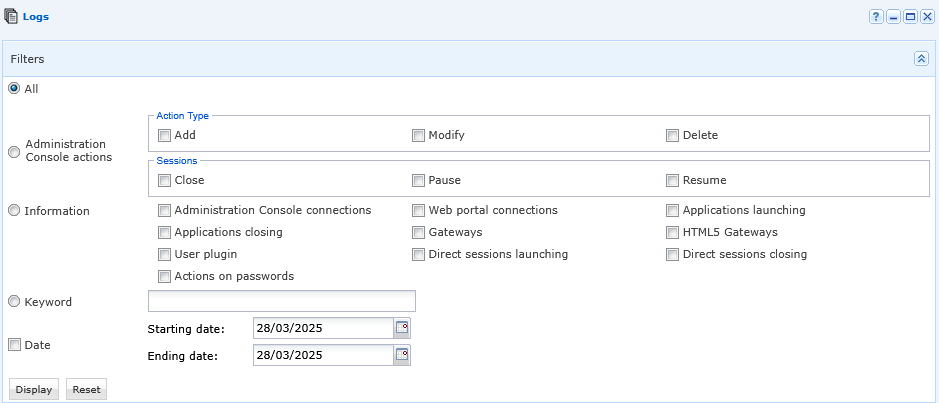
It is possible to filter the information according to the following criteria:
Administration Console actions,Information,Keyword,Date.
From the “export all pages”, it is possible to export your report in .csv format. The “Reports” menu lists all user and administrator actions and cannot be altered:
The "Reports" menu is composed of 3 other sub-menus:
Simultaneous Sessions,Statistics by User,Storage Space.


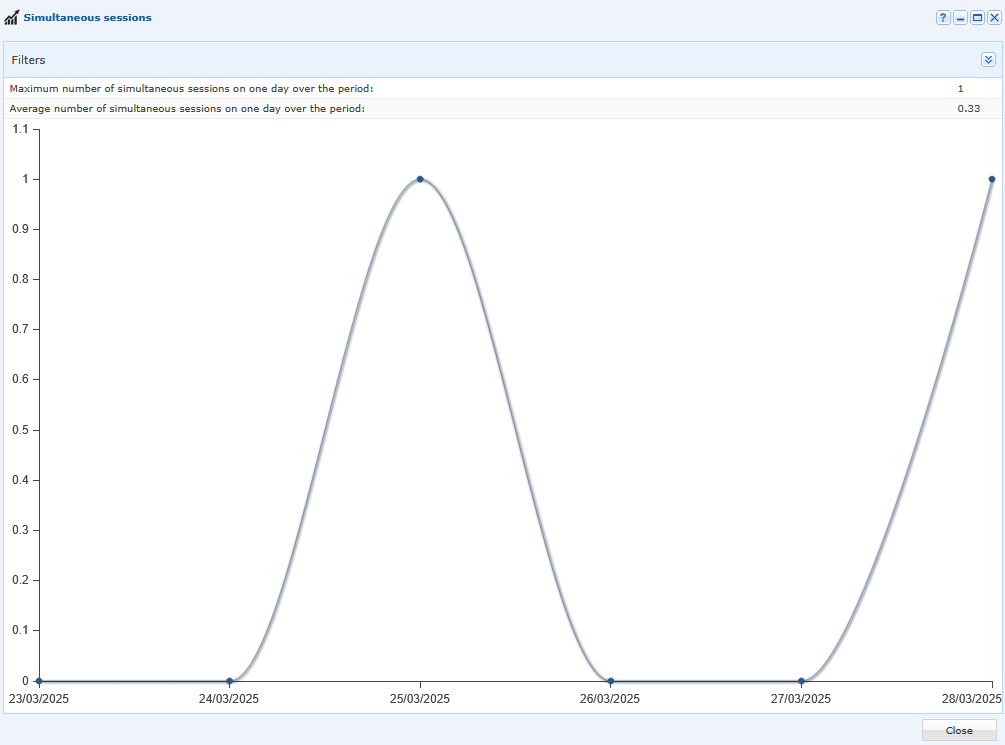
The “ Simultaneous Sessions” submenu provides a graphical overview of the number of simultaneous sessions and the “average” number during a configurable period:
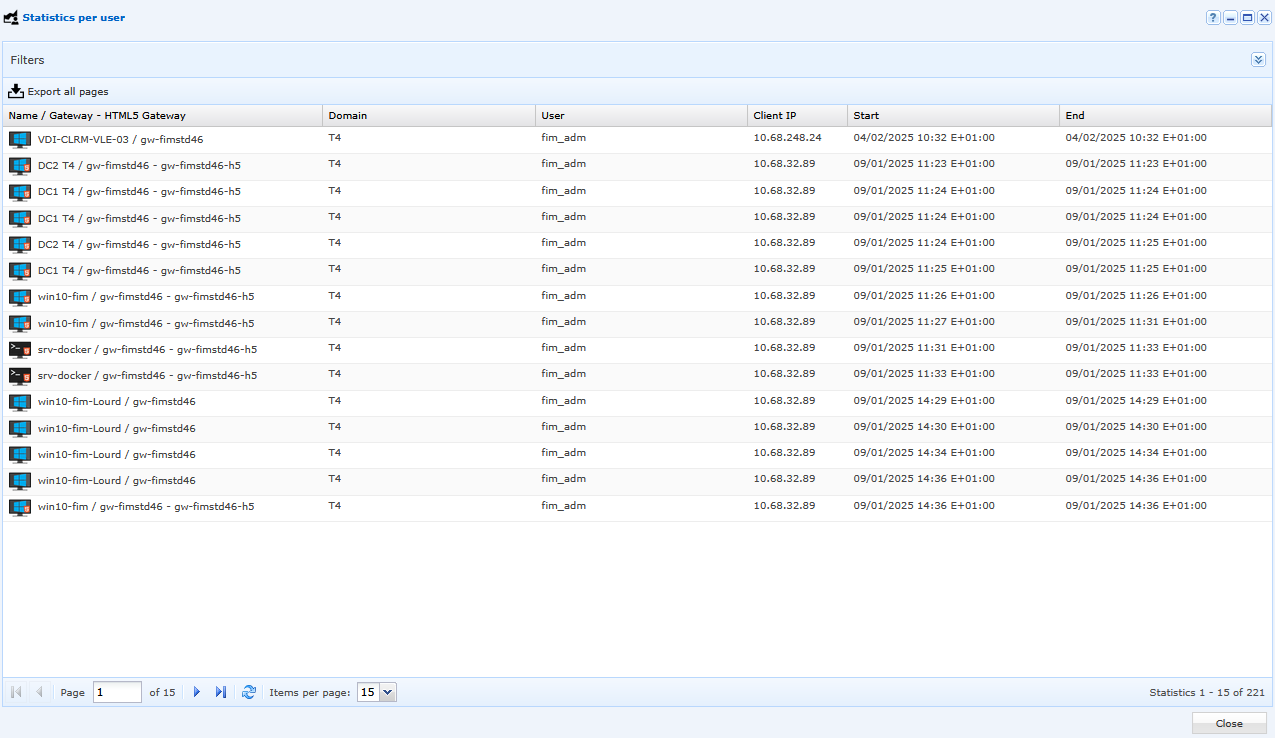
The “Statistics by User” submenu provides a detailed overview of user connections. It is possible to filter the data and export it in .csv format:
The “Storage Space” submenu provides a visual overview of the space occupied by video archives. By default, videos are stored on the Edge Gateway. As a result, users cannot access these archives:
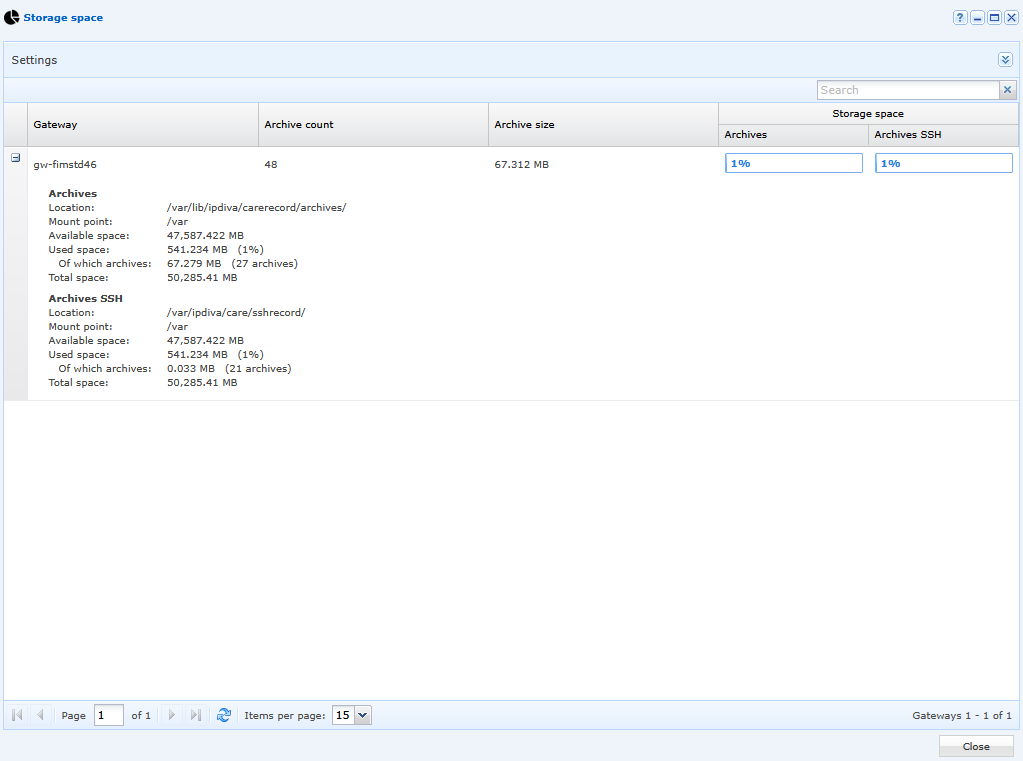
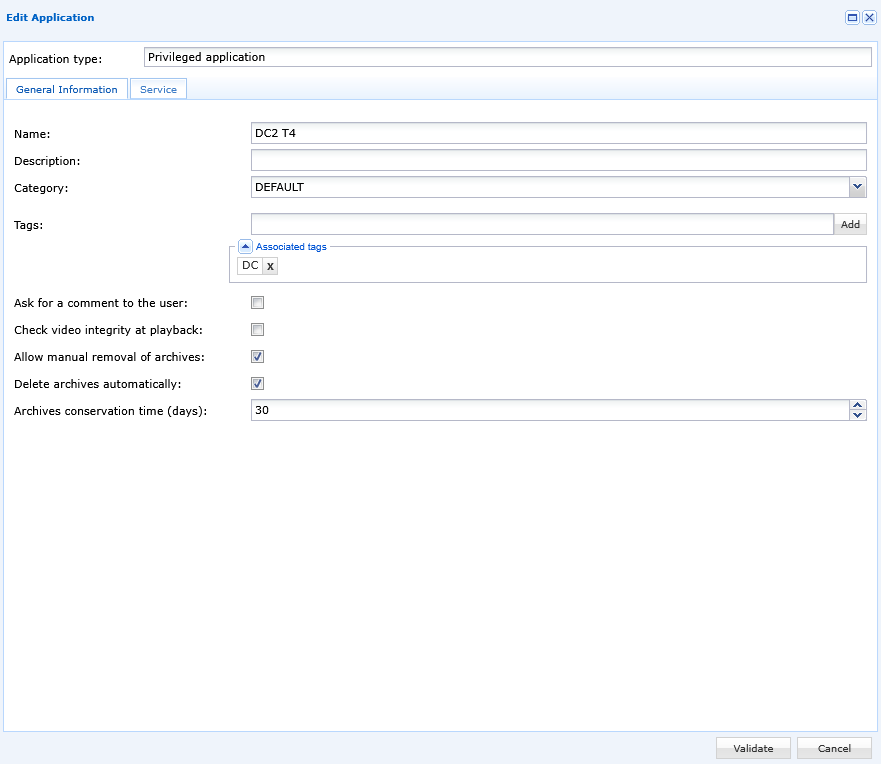
From the “Internal Resources” menu, you can edit a resource by setting up automatic deletion of its archived videos, making it easy to manage the retention period for archives: