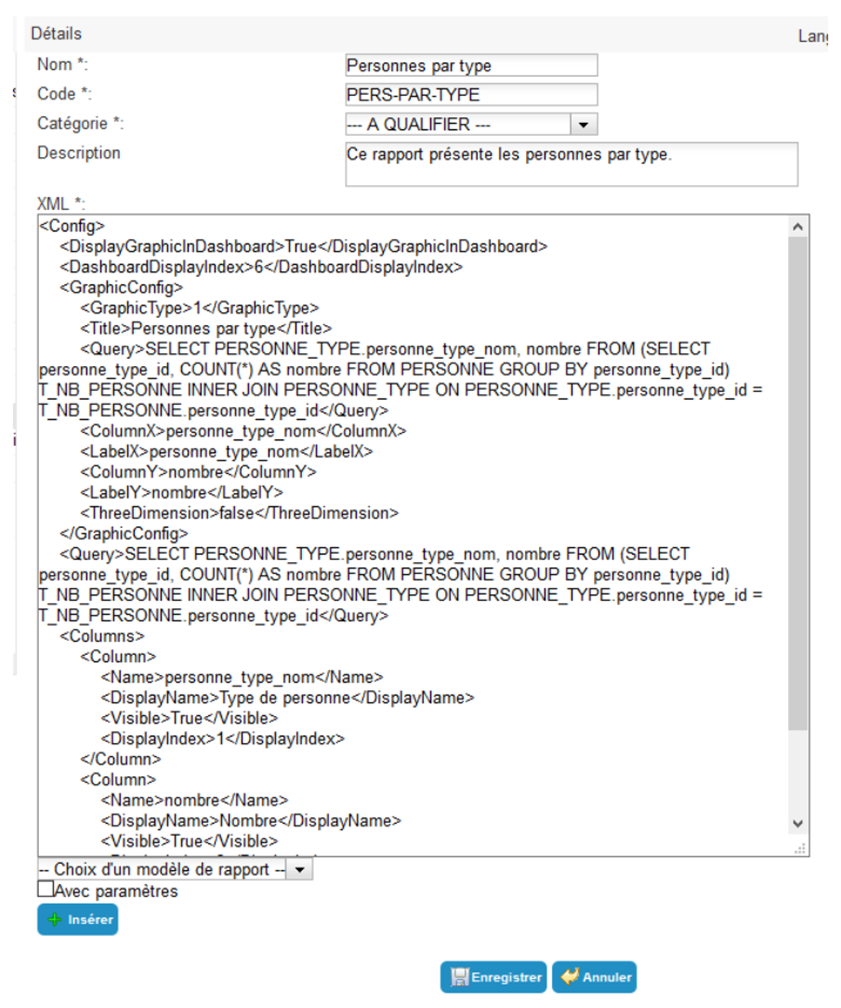
Create/modify/delete a report
The report is configured using an XML file. You need to define:
- The query on the Systancia Identity database to retrieve the desired information,
- The properties of each column to be displayed in XML format: Object type, name in the SQL database, name to be displayed, display index, etc.
- The graph display options (bar chart, pie chart, colored dots).
Click on the “New report” button to create and configure a new report.
Select a report and click on the “Modify” button to modify its configuration.
Properties of a report
| Parameter |
Description |
Types and possible values |
| Name |
Display name of the report. |
Character string. Mandatory. |
| Code |
Corresponds to the ID of the object. Its value must be unique across all reports. |
Character string , without spaces or special characters. Mandatory |
| Category |
The report category in which the list of reports will be displayed. |
List of predefined categories. |
| Description |
|
Character string. |
| XML |
XML tags describing the SQL query in the Hpliance database, the properties of each column in the report, and the properties of the graphic elements. |
Text in XML format. |
| Choice of report template |
Graphic template for the report (in addition to the data table). |
Without chart, Histogram, Stacked histogram, Pie chart, or Color ball by threshold. |
| With parameters |
Allows you to add variables entered by the user. You will need to add the tag to the XML. |
Checkbox. |
Write the XML for a simple report
 1
 2
 3
 4
 5
 6
 7
 8
 9
10
11
12
13
14
15
16
17
18
19
20
21
22
23
24
25
26
27
28
29
30
31
32
33
34
35
36
37
38
39
40
41
42
43
44
45
46
47
48
49
50
51
52
53
54
55
56
57 | <Config>
<!-- If there is a chart, indicate whether to display the chart on the dashboard -->
<DisplayGraphicInDashboard>true</DisplayGraphicInDashboard>
<!-- If there is a chart, indicate the chart display index on the dashboard -->
<DashboardDisplayIndex>0</DashboardDisplayIndex>
<!-- Indicates whether data is displayed as soon as the report page is accessed -->
<DirectDisplay>true</DirectDisplay>
<!-- The SQL query used to retrieve the data to be displayed -->
<Query></Query>
<!-- Definition of the list of columns available to the user. -->
<!-- The visibility and display index of the column can be configured by the user when viewing the report. -->
<Columns>
<!-- Definition of a column (to be duplicated as many times as necessary) -->
<Column>
<!-- The Object Type -->
<ObjectType></ObjectType>
<!-- Name of the column containing the IDs -->
<Column_Link_Id></Column_Link_Id>
<!-- The name of the field as defined in the query. -->
<Name></Name>
<!-- The default name to display to the user. -->
<DisplayName></DisplayName>
<!-- Indicates whether this column is visible by default. TRUE or FALSE -->
<Visible></Visible>
<!-- The default display index. -->
<DisplayIndex></DisplayIndex>
</Column>
</Columns>
</Config>
|
Example: List of users without a phone number
 1
 2
 3
 4
 5
 6
 7
 8
 9
10
11
12
13
14
15
16
17
18
19
20
21
22
23
24
25
26
27
28
29
30
31
32
33
34
35
36
37
38
39
40
41
42
43
44
45
46
47
48
49
50
51
52
53
54
55
56
57
58
59
60
61
62
63
64
65
66
67 | <Config>
<DisplayGraphicInDashboard>true</DisplayGraphicInDashboard>
<DashboardDisplayIndex>0</DashboardDisplayIndex>
<DirectDisplay>true</DirectDisplay>
<Query>
SELECT personne_uid,personne_display_name FROM PERSONNE
WHERE personne_id NOT IN(SELECT personne_id FROM PERSONNE_MULTIVALUED WHERE personne_schema_attribut_id = 7)
AND personne_hidden=0
</Query>
<Columns>
<Column>
<ObjectType/>
<Column_Link_Id/>
<Name/>
<DisplayName/>
<Visible/>
<DisplayIndex/>
</Column>
<Column>
<ObjectType/>
<Column_Link_Id/>
<Name>personne_uid</Name>
<DisplayName>UID</DisplayName>
<Visible>TRUE</Visible>
<DisplayIndex>1</DisplayIndex>
</Column>
<Column>
<Name>personne_display_name</Name>
<DisplayName>Nom</DisplayName>
<Visible>TRUE</Visible>
<DisplayIndex>2</DisplayIndex>
</Column>
</Columns>
</Config>
|
| XML tag |
Definition |
Possible values |
| Name |
The name of the field as it is defined in the SQL query. |
Character string. |
| Column_Link_Id |
Used for creating columns that contain clickable data. Corresponds to the name of the column containing the ID used to manage the link. |
Character string. Optional |
| ObjectType |
Target object type of the clickable link (Identity, structure). |
Identity = 1 => Redirection to the userDetails.aspx page |
|
|
Structure = 2 => Redirection to the structure.aspx page |
|
|
Optional |
| DisplayName |
Name of the column to be displayed in the interface. |
Character string. |
| Visible |
Indicates whether the column is shown or hidden. |
'TRUE' or 'FALSE' |
| DisplayIndex |
Index of the column (display order). |
Integer greater than 0 |
Adding parameters entered by the user in the report: tag
Select the “With parameters” checkbox and add the following tags to the XML:
 1
 2
 3
 4
 5
 6
 7
 8
 9
10
11
12
13
14
15
16
17
18
19
20
21
22
23
24
25
26
27
28
29
30
31 | <!-- Definition of the list of parameters expected by the report request. -->
<Parameters>
<!-- Definition of a parameter (to be duplicated as many times as necessary) -->
<Parameter>
<!-- The name of the variable as defined in the query. -->
<Variable></Variable>
<!-- The label to display to the user. -->
<Label></Label>
<!-- An integer indicating the expected data type (see documentation for possible values) -->
<DataType></DataType>
<!-- Indicates whether the user must specify a value of ‘TRUE’ or ‘FALSE’ -->
<Mandatory></Mandatory>
<!-- For optional parameters, the default value to be used if not entered by the user. -->
<DefaultValue></DefaultValue>
</Parameter>
</Parameters>
|
Example: Permissions about to expire
 1
 2
 3
 4
 5
 6
 7
 8
 9
10
11
12
13
14
15
16
17
18
19
20
21
22
23
24
25
26
27
28
29 | <Query>DECLARE @DateNow AS DATETIME; SELECT @DateNow = GETDATE(); SELECT * FROM vHABILITATIONS_FULL WHERE (date_debut_lien IS NULL OR @DateNow > date_debut_lien) AND date_fin_lien IS NOT NULL AND ((0 = @ApplicationId) OR (application_id = @ApplicationId)) AND DATEADD(dd, @NbJours, @DateNow) > date_fin_lien ORDER BY date_fin_lien ASC</Query>
<Parameters>
<Parameter>
<Variable>ApplicationId</Variable>
<DataType>4</DataType>
<Mandatory>TRUE</Mandatory>
<Label>Selectionnez l'application</Label>
</Parameter>
<Parameter>
<Variable>NbJours</Variable>
<DataType>23</DataType>
<Mandatory>TRUE</Mandatory>
<Label>Sélectionnez le nombre de jour</Label>
</Parameter>
</Parameters>
|
XML tags in <Parameter> that describe the parameters that can be entered by the user:
| XML tag |
Definition |
Possible values |
| Variable |
Name of the variable used in the SQL query (without the @). |
Character string. |
| Data Type |
The Systancia Identity object type corresponding to the parameter. If it is not a basic object type (date, string, integer, etc.), the parameter will be a drop-down list containing the possible values. |
Structure=2; Authorization Rule=3; Application=4; Repository=5; Right=8; StructureType=11; Tree=12; AdminProfile=18; PersonType=19; String=22; Integer=23; Boolean=24; Date=25. |
| Label |
Label to be displayed to the user. |
Character string. |
| AttributeCode |
PSA attribute code. |
Character string corresponding to a PSA code. |
| Mandatory |
Indicates whether the user is required to specify a value. |
'TRUE' or 'FALSE |
| DefaultValue |
For optional parameters, this is the default value that is entered if there is no entry input by the user. |
Character string. |
Defining the parameters for graphics
Select the graphic template from the drop-down list and add the following tags to the XML:
 1
 2
 3
 4
 5
 6
 7
 8
 9
10
11
12
13
14
15
16
17
18
19
20
21
22
23
24
25
26
27
28
29
30
31
32
33
34
35 | <GraphicConfig>
<!-- The type of graph (1=Histogram, 2=Stacked histogram, 3=Pie chart, 4=Colored ball per threshold -->
<GraphicType>1</GraphicType>
<!-- Graph title (if not specified, the report name will be used -->
<Title></Title>
<!-- The query to use to retrieve the data that will be used to generate the graph -->
<Query></Query>
<!-- The name of the query field that will serve as the x-axis -->
<ColumnX></ColumnX>
<!-- The name of the query field that will serve as the y-axis -->
<ColumnY></ColumnY>
<!-- The label of the x-axis -->
<LabelX>Label of column X</LabelX>
<!-- The label of the y-axis -->
<LabelY>Label of column Y</LabelY>
<!-- Indicates whether the graph is in 3 dimensions -->
<ThreeDimension>false</ThreeDimension>
</GraphicConfig>
|
Stacked histogram
Insert the following tags into the tag:
 1
 2
 3
 4
 5
 6
 7
 8
 9
10
11
12
13
14
15
16
17
18
19
20
21
22
23
24
25
26
27
28
29
30
31 | <!-- 0 = each compiled block corresponds to a column of data (default value) -->
<!-- 1 = each compiled block corresponds to a grouping of data from a single column of data -->
<StackColumnMode></StackColumnMode>
<!-- Definition of the list of columns to stack. -->
<StackedColumns>
<!-- Definition of a column (to be duplicated as many times as necessary) -->
<StackedColumn>
<!-- StackColumnMode = 0: The name of the field that contains the data as defined in the query. -->
<!-- StackColumnMode = 1: The name of the field that allows you to create stackable blocks. (YColumn contains the data) -->
<DataField></DataField>
<!-- The name to display to the user. -->
<DisplayName></DisplayName>
<!-- Defines the color of the stacked block (HTML code or color name) -->
<Color></Color>
</StackedColumn>
</StackedColumns>
|
Colored circle per threshold
Insert the following tags into the tag:
 1
 2
 3
 4
 5
 6
 7
 8
 9
10
11
12
13
14
15
16
17
18
19
20
21
22
23 | <!-- Definition of thresholds -->
<Intervals>
<!-- Definition of a threshold (to be duplicated as many times as necessary) -->
<Interval>
<!-- Minimum threshold included -->
<Min></Min>
<!-- Maximum threshold excluded -->
<Max></Max>
<!-- Color of the ball for the defined threshold (HTML code or color name) -->
<Color></Color>
</Interval>
</Intervals>
|
Translating the names of the columns in a report
The columns and values included in the results of a report can be translated into several languages.
The following is an example of a report in which the columns have been translated:
 1
 2
 3
 4
 5
 6
 7
 8
 9
10
11
12
13
14
15
16
17
18
19
20
21
22
23
24
25
26
27
28
29
30
31
32
33
34
35
36
37
38
39
40
41
42
43
44
45
46
47
48
49
50
51
52
53
54
55
56
57
58
59
60
61
62
63
64
65
66
67
68
69
70
71
72
73
74
75
76
77
78
79
80
81
82
83
84
85
86
87 | <Config>
<DisplayGraphicInDashboard>True</DisplayGraphicInDashboard>
<DashboardDisplayIndex>5</DashboardDisplayIndex>
<GraphicConfig>
<GraphicType>1</GraphicType>
<Title>Nombre de personnes par application et type de compte</Title>
<Query>SELECT APPLICATION.application_nom + ' - ' + compte_type_nom as Administrateur, T_PERSONNE_APPLICATION_GROUPED.total FROM (SELECT application_id, compte_type_id, COUNT(*) AS total FROM (SELECT DISTINCT personne_id, vPERSONNE_COMPTE_DROIT.application_id, compte_type_id FROM vPERSONNE_COMPTE_DROIT INNER JOIN DROIT ON DROIT.droit_id = vPERSONNE_COMPTE_DROIT.droit_id) T_PERSONNE_APPLICATION GROUP BY application_id, compte_type_id) T_PERSONNE_APPLICATION_GROUPED INNER JOIN APPLICATION ON APPLICATION.application_id = T_PERSONNE_APPLICATION_GROUPED.application_id INNER JOIN COMPTE_TYPE ON COMPTE_TYPE.compte_type_id = T_PERSONNE_APPLICATION_GROUPED.compte_type_id ORDER BY total DESC</Query>
<ColumnX>Administrateur</ColumnX>
<LabelX>Nom de l'administrateur</LabelX>
<ColumnY>total</ColumnY>
<LabelY>Nombre de compte</LabelY>
<ThreeDimension>false</ThreeDimension>
</GraphicConfig>
<Query>SELECT APPLICATION.application_culture, APPLICATION.application_nom, compte_type.compte_type_nom, compte_type.compte_type_culture, T_PERSONNE_APPLICATION_GROUPED.total FROM (SELECT application_id, compte_type_id, COUNT(*) AS total FROM (SELECT DISTINCT personne_id, vPERSONNE_COMPTE_DROIT.application_id,
compte_type_id FROM vPERSONNE_COMPTE_DROIT INNER JOIN DROIT ON DROIT.droit_id = vPERSONNE_COMPTE_DROIT.droit_id) T_PERSONNE_APPLICATION GROUP BY application_id, compte_type_id) T_PERSONNE_APPLICATION_GROUPED INNER JOIN APPLICATION ON APPLICATION.application_id = T_PERSONNE_APPLICATION_GROUPED.application_id INNER JOIN COMPTE_TYPE ON COMPTE_TYPE.compte_type_id = T_PERSONNE_APPLICATION_GROUPED.compte_type_id ORDER BY total DESC</Query>
<Columns>
<Column>
<Name>application_nom</Name>
<DisplayName>Application</DisplayName>
<Visible>True</Visible>
<DisplayIndex>1</DisplayIndex>
<Internationaldisplayname Lang="FR">Application_FR</internationaldisplayname>
<Internationaldisplayname Lang="EN">Application_EN</internationaldisplayname>
<CultureColumnName Prop="Name">application_culture</CultureColumnName>
</Column>
<Column>
<Name>compte_type_nom</Name>
<DisplayName>Compte type</DisplayName>
<Visible>True</Visible>
<DisplayIndex>2</DisplayIndex>
<Internationaldisplayname Lang="FR">Compte type</internationaldisplayname>
<Internationaldisplayname Lang="EN">Account type</internationaldisplayname>
<CultureColumnName Prop="Name">compte_type_culture</CultureColumnName>
</Column>
<Column>
<Name>total</Name>
<DisplayName>Nombre</DisplayName>
<Visible>True</Visible>
<DisplayIndex>3</DisplayIndex>
<internationaldisplayname Lang="FR">Nombre</internationaldisplayname>
<internationaldisplayname Lang="EN">Number</internationaldisplayname>
</Column>
</Columns>
</Config>
|
XML tag
- Internationaldisplayname:
- Definition: Tag used to translate the names of the columns returned by the report. There must be as many instances of this tag as there are languages configured in Systancia Identity.
- Attribute: Lang=“<\language_code>” where <\language_code> represents the language code defined in the language settings in the General > Application Settings tab.
- Possible value: Character string. The name of the column displayed in the report for the language.
- CultureColumnName:
- Definition: Definition of the culture XML that is used to translate the contents of the table generated by the report.
- Attribute: Prop=“<\XML_Attribute>” where <\XML_Attribute> represents the attribute of the XML property corresponding to the different values in the column.
- Possible value: Character string. SQL query culture column.
Displaying a report based on the user context
In version 4000 of Hpliance, it is possible to add an invisible parameter to a report that will be defined according to the person running the report. The values in the report will be displayed according to the values of a user attribute. For example, they will only see the results for their organization.
Report example: List all permissions assigned to the identities in a given structure. Display the last names, first names, permissions, and applications of all identities for which the "Responsibility" structure attribute matches the structure attribute of the connected user.
  1
  2
  3
  4
  5
  6
  7
  8
  9
 10
 11
 12
 13
 14
 15
 16
 17
 18
 19
 20
 21
 22
 23
 24
 25
 26
 27
 28
 29
 30
 31
 32
 33
 34
 35
 36
 37
 38
 39
 40
 41
 42
 43
 44
 45
 46
 47
 48
 49
 50
 51
 52
 53
 54
 55
 56
 57
 58
 59
 60
 61
 62
 63
 64
 65
 66
 67
 68
 69
 70
 71
 72
 73
 74
 75
 76
 77
 78
 79
 80
 81
 82
 83
 84
 85
 86
 87
 88
 89
 90
 91
 92
 93
 94
 95
 96
 97
 98
 99
100
101
102
103
104
105
106
107
108
109 | <Config>
<DirectDisplay>true</DirectDisplay>
<Query>select P.personne_id,P.personne_nom, P.personne_prenom, D.droit_nom, A.application_nom
from vHABILITATIONS_ALL AS VHA
inner join LIEN_PERSONNE_STRUCTURE AS LPS ON LPS.personne_id = VHA.personne_id
inner join DROIT AS D ON D.droit_id = VHA.droit_id
inner join PERSONNE AS P ON P.personne_id = VHA.personne_id
inner join APPLICATION AS A ON A.application_id = D.application_id
where structure_id in
(select * from dbo.fctSplitString(dbo.fctGetAttributeValueByPersonneIdAndPersonneSchemaAttributCode(@personneId, 'responsabilite'), '|'))
</Query>
<Columns>
<Column>
<Name>personne_id</Name>
<DisplayName>ID</DisplayName>
<Visible>False</Visible>
<DisplayIndex>1</DisplayIndex>
</Column>
<Column>
<Name>personne_nom</Name>
<DisplayName>Nom</DisplayName>
<Visible>True</Visible>
<DisplayIndex>2</DisplayIndex>
<ObjectType>1</ObjectType>
<Column_Link_Id>personne_id</Column_Link_Id>
</Column>
<Column>
<Name>personne_prenom</Name>
<DisplayName>Prénom</DisplayName>
<Visible>True</Visible>
<DisplayIndex>2</DisplayIndex>
<ObjectType>1</ObjectType>
<Column_Link_Id>personne_id</Column_Link_Id>
</Column>
<Column>
<Name>droit_nom</Name>
<DisplayName>Droit</DisplayName>
<Visible>True</Visible>
<DisplayIndex>3</DisplayIndex>
</Column>
<Column>
<Name>application_nom</Name>
<DisplayName>Application</DisplayName>
<Visible>True</Visible>
<DisplayIndex>4</DisplayIndex>
</Column>
</Columns>
<Parameters>
<Parameter>
<Variable>personneId</Variable>
<AttributUserConnected>True</AttributUserConnected>
<AttributeCode>personne_id</AttributeCode>
</Parameter>
</Parameters>
</Config>
|
XML tags that describe the parameters based on the user's context.
- Variable:
- Definition: Name of the variable used in the SQL query (without the @).
- Possible value: Character string.
- AttributUserConnected:
- Definition: Specifies whether the parameter is defined based on the context of the current user, or whether it needs to be entered manually from the interface.
- Possible value:
- True: User context
- False: Manual entry
- AttributeCode:
- Definition: PSA attribute code.
- Possible value: Character string corresponding with the PSA code.